
|
I get a lot of questions on the Performance Management Chart (PMC) from athletes. Its a popular topic that can get complicated quickly, so thought I would post a short primer that goes over the basics. The PMC and its related terminology was developed originally by Dr. Andy Coggan. TrainingPeaks licenses the concepts and an automated version is built into the TrainingPeaks tool. When looking at the physical/fitness components of training, the most fundamental elements any coach or athlete need to consider in prescribing a training plan are: volume (how much) intensity (how hard) and frequency or recovery (how often) a training “load” is being applied to an athlete. The PMC provides coaches and athletes an objective way to monitor fitness, stress loads and fatigue levels to better manage these factors. Here is a sample chart for reference as we walk through the elements: 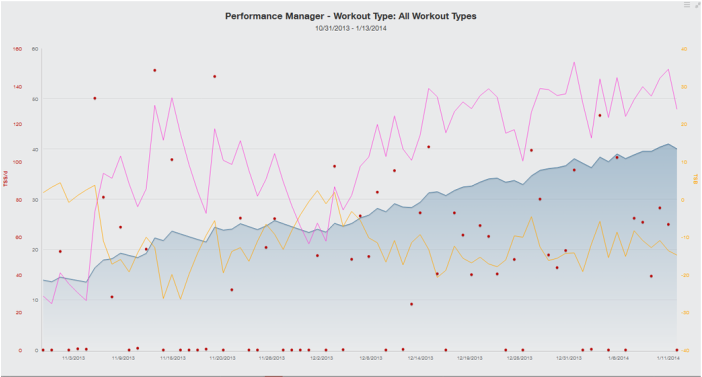 Sample Performance Management Chart The red “dots” are an index of “stress” for individual workouts based on the intensity and duration, called Training Stress Score or TSS. As a baseline, the power, HR or average pace an athlete can hold for 1 hr all out results in a 100 TSS. This is also considered the athlete’s threshold power, HR or pace. TSS for individual workouts are calculated based on the intensity and duration and are the basic data elements for the remaining calculations. A high intensity short workout and a lower intensity longer workout could both trigger a similar training stress score (TSS). A key point here, the more accurate the athlete’s threshold numbers for power, HR and/or pace are, the more useful these charts are in monitoring the athlete’s status.
The pink line is an index measuring the exponential avg amount of TSS the athlete has accumulated during an acute or short 1 week period (ATL for Acute Training Load). It’s also described as “fatigue” or the short term stress that athlete has been subjected to. The blue line is similar, but it’s the exponential avg TSS over a chronic or longer 42 day period (CTL or Chronic Training Load). It’s also described as “fitness” or the long term stress the athlete has been subjected to. The 7 and 42 day periods are defaults that have proven to be good markers based on research. TrainingPeaks actually allows you to change these defaults if you desire, but I have not really found a case where that is necessary. The literature associated with this approach outlines some general ranges for CTL. Personally, I have not found these values to reflect a reasonable load for most working athletes. From my experience, it’s difficult to account for daily work related stress, running around, chasing kids, up early, to bed late etc. I have found that “target” values over a season are individual. I recommend paying the most attention to the slope of CTL (fitness) and how steadily an athlete is progressing over time as stress is added via either volume or intensity or both. TrainingPeaks mobile provides metrics to track these trends as well. The yellow line (Training Stress Balance or TSB) is basically the difference between fitness and fatigue and it correlates to how “tired” or how “fresh” an athlete might be given how much short term and long term stress has accumulated. For example, a 4 hr ride with tempo efforts in it early in the season when an athlete is less fit will likely make the athlete more tired, and require more recovery, than the same ride later in the season when an athlete is more fit and has more “work” under their belt. TSB can be very useful in correlating and even predicting when an athlete is going to feel pretty good or might start feeling tired, drug out an at risk for illness. Like everything, it is a little different for each individual, but in general under a good load, -10 to -20 seems to be about as deep as you want to go for any period of time. Most athletes hitting below -20 generally start seeing some lingering fatigue, feel tired and run higher risk of illness. Start getting into +10 and above and the athlete may feel tired at first as their body starts to shift to recovery mode, but then they usually feel good shortly after that, this is usually where we want to see you after a rest period and going into bigger races. Again the specifics depend on the individual and how accurate their threshold numbers are, but the general trends seem to hold. I can't stress enough that you shouldn't base everything on this chart, just like you would never drive your car using gauges alone. The chart is a great decision support tool, especially for remote coaches who are trying to gain insight into how their athletes are responding to the training plans they are being prescribed. For more info on TSS and the PMC, check out these TrainingPeaks articles: http://home.trainingpeaks.com/blog/article/applying-the-numbers-part-2-training-stress-score https://www.trainingpeaks.com/blog/what-is-the-performance-management-chart/ Fantastic to get another opportunity to work with TrainingPeaks on a guest blog post. This article provides an overview of a new modeling tool called Best Bike Split that can provide insight into time trial and triathlon bike split planning and execution. Check out the full article here:  Fantastic to get the opportunity to guest blog for the TrainingPeaks blog! Check out my post that outlines Normalized Power and how its used.   Making the decision to start using power as a training tool can be both exciting and intimidating at the same time. Here are 6 practical tips that will hopefully help make the power learning curve a little less steep for beginners, and are great reminders for the experienced power meter user as well.
"Ask A Coach" is intended to address some fundamental training questions that come up from athletes time to time. The focus is on questions that experienced athletes may take for granted, and new athletes may be afraid to ask. What is power and what will a power meter do to make me faster? Last time, we went over the fundamentals of power and power meters. If you missed it, you can check it out here. To understand how power can be used in a training program, let’s first consider the most fundamental aspects of training itself.
An athlete improves or becomes more “fit” by applying stress to their body through a combination of exercise volume and intensity. The body at first breaks down and then adapts to that stress via recovery. In turn the athlete becomes stronger through that adaptation and can then handle additional stress via more volume and/or intensity and the cycle repeats. Sounds simple enough, but every person and their situation is different. So when developing a training protocol there are many fundamental questions: How much stress for how long is enough for a particular athlete? How much is too much? When does an athlete need to recover and for how long? Is the athlete getting “fitter” or not? Given this variability, determining the optimum duration and intensity of exercise for a particular ability level, physiology, goals and time is the big challenge for any athlete and for coaches working with them. Having objective insight into what the body is doing on a given day, and what the physiological limits of the body are at any given period during a training cycle, is hugely beneficial and is what power capture and monitoring provide. Prior to power, perceived effort or “feel” and heart rate were the primary methods available to manage an athlete’s training protocols. Each of these methods still has value, and can be used alone or alongside power, but each have limitations and issues to consider. Subjective “feel” is still a very important thing for athletes to develop. But, interpretation of “sensations” as they relate to what is actually going on in the body can be right on or misleading depending on the individual when used alone. Plus, if the athlete is using a coach, there is the additional challenge of communication and interpretation to ensure coach and athlete are on the same page. It takes time to sort out the signals an athlete’s body is sending, and there is a lot more trial and error in the process and more room for misinterpretation of signals. Heart rate (HR) was a step in the right direction of removing some subjectivity, but it’s a lagging indicator, meaning its giving you an indicator of what HAS happened where power is giving you an indicator of what is happening right at that instance in time. Additionally, HR is impacted more by environmental conditions and hydration in its effectiveness. As of today, power is the most direct and “pure” objective measurement of effort we have. Through the use of some fundamental exercise science principals, and a couple of decades worth of real world testing and analysis, an athlete or coach well versed in power training can more precisely adjust and monitor an athlete’s training protocols. There are also methods to monitor stress levels, “fitness”, and recovery allowing for more accurate adjustments to duration and intensity both short and long term. All that said, a power meter is not a prerequisite for riding a bike. Even if you have competitive goals, there is nothing wrong with grabbing a bike and just riding. Especially if you are new to the sport, the additional information can be overwhelming at the start and may stifle the development of good instincts and “feel”. Also, some people have a fantastic intuitive sense of feel either naturally or developed over time, and can effectively self-monitor effort levels. Other athletes may have a long history of using HR and can still very effectively train using either of those methods alone. But in any case, if you have performance goals and have access to someone with knowledge in looking at the data and applying it (or spend the time to learn how to do it yourself), a power meter is only going to provide additional insight into your training effectiveness. Ultimately this insight can help you get to your goals quicker and more precisely develop and monitor your training to do so. "Ask A Coach" is intended to address some fundamental training questions that come up from athletes time to time. The focus is on questions that experienced athletes may take for granted, and new athletes may be afraid to ask. Hopefully this is more popular than the short lived "Ask A Couch" which didn't get very far. What is power and what will a power meter do to make me faster? I am going to break this question into two parts. First let’s start off with what power is, and what a power meter is and does, then in the next entry, we will go into some more detail on the benefits of power in a training program and how a knowledgeable athlete or coach can use it to positive effect.
Without getting too science-y, power is the rate of work (or force times distance) a system is producing over time. That rate of work is represented in Watts which is Joules/Second or more simply energy expended per second. A power meter, is a strain gauge and some electronics packed either in a crank set, pedals or the rear hub of a wheel. When you apply force to the pedals, the meter can sense disturbances in that force applied. (sorry, Obi Wan, couldn’t help myself) The meter also has a way to transmit that force reading to a handlebar display and capture device. The combination of these two devices measures the work being done and displays it in Watts instantaneously for the rider to see, in addition to capturing a data stream of power readings, usually in 1 second samples, of an entire workout for further analysis post exercise. So in a simple but fuller picture, your body turns food into biochemical energy, and that biochemical energy is turned into mechanical energy when you turn the pedals. You are literally “doing work” by applying force to the pedals, producing power which is measured in Watts and in turn making speed! The meter is capturing a record of that output and displaying the immediate power output instantaneously. None of this on its own makes a rider a faster. The meter and display unit are just giving you a number on your handlebar that changes every second depending on how “hard” or “soft” you are turning the pedals. The value comes in the interpretation of that data by a knowledgeable individual and then applying it to an athlete’s training program. The data captured by the meter provides insight into the athlete’s current ability and how hard or easy they are training at a given time, and enables the establishment of parameters to optimize how an athlete trains given their ability, goals, potential and individual situation. The less time and more constraints they have, the more beneficial this becomes to whomever is designing the athlete's training approach. Next time we will go into a bit more detail why using power in training can be beneficial relative to other methods of measuring effort. If you have questions or comments, please feel free to post up. |
|
|
|

|
Website Design and Content © 2015-2022 Otterhaus Enterprises LLC, All Rights Reserved